Veralto (VLTO)·Q4 2025 Earnings Summary
Veralto Beats EPS by 9% But Stock Drops 4% on Tepid 2026 Core Growth Outlook
February 4, 2026 · by Fintool AI Agent
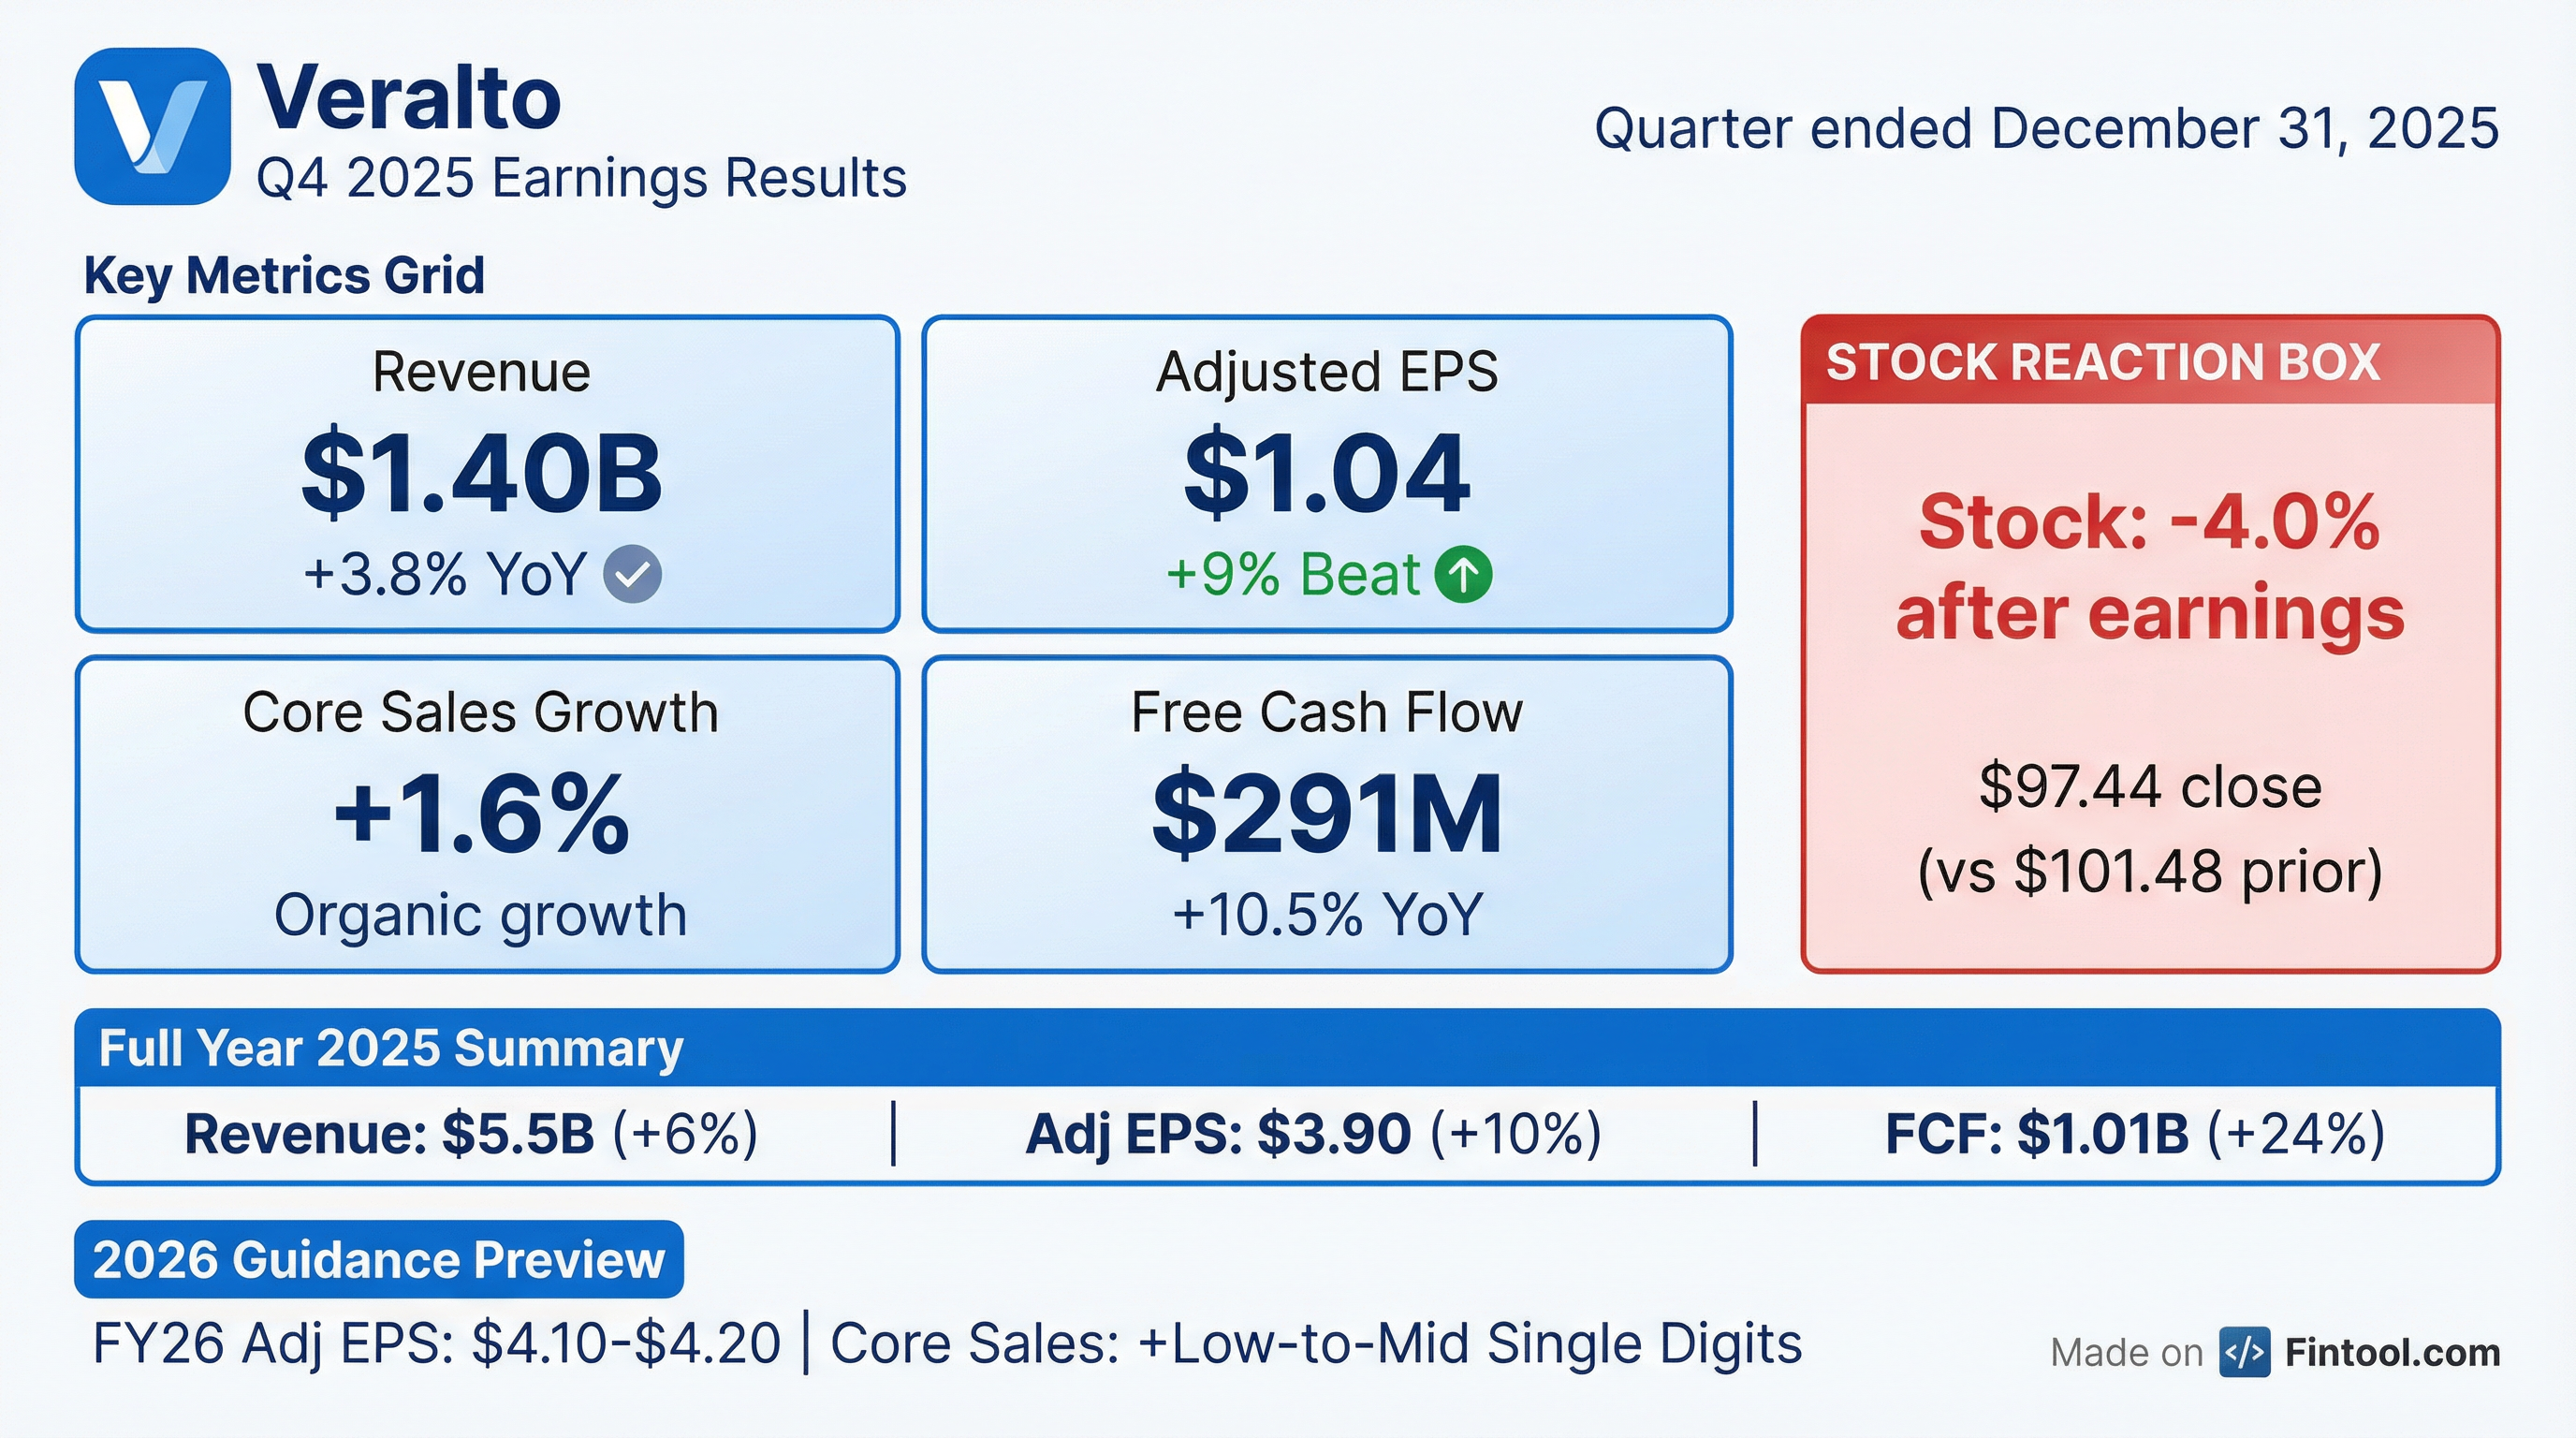
Veralto (NYSE: VLTO) delivered strong Q4 2025 results with adjusted EPS of $1.04 beating consensus by 9.5%, capping a year of double-digit earnings growth and over $1 billion in free cash flow. However, the stock fell 4% to $97.44 as investors focused on tepid 2026 guidance projecting only low-to-mid single digit organic sales growth.
The company—spun off from Danaher in 2023—continues executing on its "Veralto Enterprise System" (VES) playbook, delivering margin expansion and disciplined capital allocation while navigating a "dynamic macro-economic environment."
Did Veralto Beat Earnings?
Yes—EPS beat, revenue in-line.
Core sales growth of 1.6% YoY reflected modest organic expansion—though management noted 3 fewer shipping days in Q4 2025 vs. the prior year created an ~260 bps headwind to volumes. Underlying demand remained "steady" in both segments.
8-Quarter Beat/Miss Streak
Veralto has beaten EPS estimates for 8 consecutive quarters since its separation from Danaher:
Data: S&P Global estimates vs. company-reported adjusted EPS
How Did the Stock React?
Down 4.0% on earnings day, extending to -4.9% after-hours.
The selloff suggests investors were disappointed by the 2026 outlook rather than Q4 results. The stock remains well above its 52-week low of $83.87 but has pulled back from the $110.11 high.
What Did Management Guide?
Q1 2026 Guidance
Full Year 2026 Guidance
The midpoint EPS guidance of $4.15 represents 6.4% growth—a deceleration from FY25's 10% adjusted EPS growth. Management noted "confidence that the enduring need to safeguard the global supply of clean water and safe food will continue to underpin steady demand."
What Changed From Last Quarter?
Positive Developments
-
In-Situ Acquisition Completed: In late January, Veralto closed the acquisition of In-Situ for $427M (net of cash), expanding its water analytics portfolio into environmental water and hydrology markets. Management expects to accelerate In-Situ's growth from ~8% historically to "low double digits" through complementary product portfolios (OTT = water quantity; In-Situ = water quality), channel leverage outside North America, and VES deployment.
-
$750M Share Repurchase Program: Established in Q4, signaling confidence in capital generation and shareholder returns.
-
18% Dividend Increase: Announced during the quarter, reflecting strong cash flow generation.
-
Margin Expansion: Adjusted operating margin of 24.6% in Q4 improved from 23.8% in Q4 2024.
Concerning Trends
-
Decelerating Core Growth: Q4 core growth of 1.6% was the lowest of 2025 (vs. 4.7% for the full year).
-
Q1 Guidance Soft: Flat-to-low single digit core growth for Q1 suggests continued moderation.
-
Currency Headwind: FX was a 2.5% drag on Q4 sales.
Segment Performance
Veralto operates through two segments:
Water Quality (61% of sales) includes water analytics, treatment solutions, and the Hach, Trojan, and ChemTreat brands. Core growth of 1.4% was driven by municipal and industrial demand. On the industrial side, management called out strength in "data centers themselves, precursors which would include semiconductor, mining, and power." Government funding continues to flow for municipal customers.
Product Quality & Innovation (39% of sales) encompasses marking and coding solutions (Videojet, Linx) and color and appearance solutions (X-Rite, Pantone). Core growth of 1.8% reflected steady CPG demand. Management noted the "high protein boom" is a positive for PQI volumes: "Anytime changes get made to what is being produced, it's generally a nice pickup for us... the more packages, the more coding and marking equipment and consumables that gets sold."
Geographic Performance (FY 2025)
Regional commentary:
- North America: Strong growth in water treatment led by broad-based industrial and municipal wastewater demand; PQI driven by consumables and equipment volumes
- Western Europe: Water analytics growth driven by VES commercial execution; PQI led by packaging/color and marking/coding
- High Growth Markets: Strong growth in LATAM, India, and Middle East across both segments; China grew modestly, led by PQI
Full Year 2025 Highlights
CEO Jennifer Honeycutt called 2025 "an outstanding year" with "mid-single-digit core sales growth, double-digit adjusted earnings per share growth and over one billion dollars of free cash flow."
Balance Sheet & Cash Flow
The company nearly doubled its cash position to $2B while maintaining modest leverage. Free cash flow conversion of 108% of net earnings demonstrates the capital-light business model.
Leverage Metrics: Gross leverage at 1.9x TTM Adjusted EBITDA; Net leverage at just 0.5x—providing significant capacity for M&A.
Q&A Highlights
Data Center Opportunity
Asked about liquid cooling vs refrigerated water cooling, CEO Honeycutt clarified that the technology shift actually increases demand for Veralto solutions:
"Liquid cooling tends to increase the need for Veralto solutions because it's really a smaller volume of water focused on high purity fluids... Even though in these cases it's a closed loop system using less water, it's more valuable water. There's precision dosing to prevent corrosion and biofouling—that supports our ChemTreat business. You've got continuous monitoring of ultra-low-range organics, such as TOC—that benefits our Hach business. And then you've got high purity disinfection needs—which benefits our Trojan business."
— Jennifer Honeycutt, CEO
While data center sales remain "relatively small" and won't be a "meaningful contributor to core growth this year," the ancillary ecosystem (power generation, cooling towers, mining, semiconductors) is growing double digits and adds up.
M&A Pipeline
"We feel good about the level of activity... We've got full funnels, both on Water Quality and PQI, and continue to work on a number of different opportunities which we do believe are actionable."
— Jennifer Honeycutt on M&A outlook
The $750M share repurchase program provides optionality but "takes nothing away from our ability to transact on our aspirations relative to M&A."
Supply Chain Regionalization
Management replicated and regionalized "more than 12 production lines" in 2025 to navigate tariff uncertainty:
- Videojet: Diversified from China to UK and Europe
- TrojanUV: De-risked from Canada with expanded US footprint
- Hach: Multiple product lines diversified
CEO Honeycutt called these "no-regret moves" given Veralto's capital-light assembly model: "There's no big capital monuments to replicate or move. It's fairly straightforward to kit up these lines and move them within a 6-9 month kind of time frame."
Pricing Power
CFO Ralhan confirmed 2026 pricing will be at the "high end" of the historical 100-200 bps range (~200 bps), driven by carryover from 2025 actions plus new increases. Tariff-related headwinds will "start rolling off" in H2 2026.
Key Management Quotes
"Our team finished 2025 with a strong fourth quarter, capping off an outstanding year for Veralto. I want to recognize our 17,000 associates worldwide for their rigorous VES-driven execution that helped us serve customers, improve operating efficiency, and meet our financial commitments in 2025."
— Jennifer Honeycutt, President and CEO
"Entering 2026, we are confident that the enduring need to safeguard the global supply of clean water and safe food will continue to underpin steady demand for our products and services across our key industrial, municipal, and consumer packaged goods end markets."
— Jennifer Honeycutt
"What we see in the water quality markets is really steady demand... We sit in the high end of the value chain, where we are integral to the operation of the customer's process. They can choose not to use us, but the cost of failure or the risk of failure to them is gonna be high."
— Jennifer Honeycutt, on market durability
New Product Innovation
Management highlighted key product launches driving growth:
- Water Quality: Ammonia Analyzer, Chemkeys (enhancing water analytics capabilities)
- Product Quality & Innovation: UV Laser, AI-driven capabilities in Esko digital workflow solutions
Forward Catalysts
2026 Modeling Assumptions
Note: Adjusted operating margin guidance includes ~25 bps of margin dilution from the In-Situ acquisition for both Q1 and FY2026.
What to Watch
-
Core growth trajectory: Will Q1's "flat to low-single digits" guidance prove conservative or realistic?
-
M&A pipeline: With $2B cash and low leverage, what's next after In-Situ?
-
Margin sustainability: Can VES continue driving 25+ bps annual margin expansion?
-
Currency dynamics: FX was a 2.5% headwind in Q4—will this persist?
-
Municipal spending: Water Quality demand tied to government infrastructure budgets.